Ladders (DNA size standards)
My marker is not in the first lane - What can I do?
If your input is a table, simply rename the column with the marker intensities to Ladder. No matter where the column is, it will be used as the ladder by autodetection.
Alternatively, force to use a specific lane running DNAvi with –marker_lane or -ml tag. This works for images as well.
dnavi -i electropherogram.csv -l ladder.csv -m meta.csv --marker_lane 3
E.g. with above code the 3rd lane/column will be used as DNA marker.
Ladder processing in DNAvi
Overview
DNAvi utilizes SciPy’s find_peaks() function to detect DNA size marker bands. You can directly evaluate the output of this function in the ladder plot provided in the QC folder.
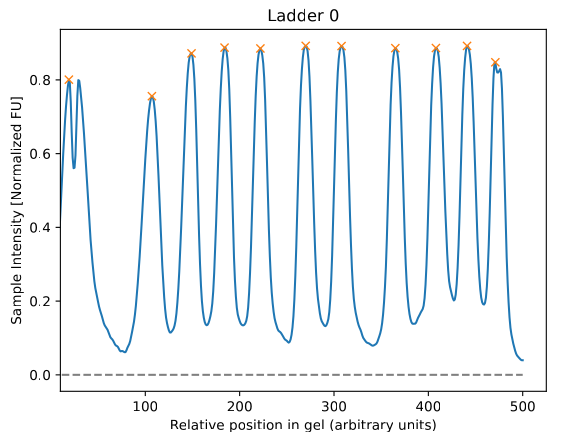
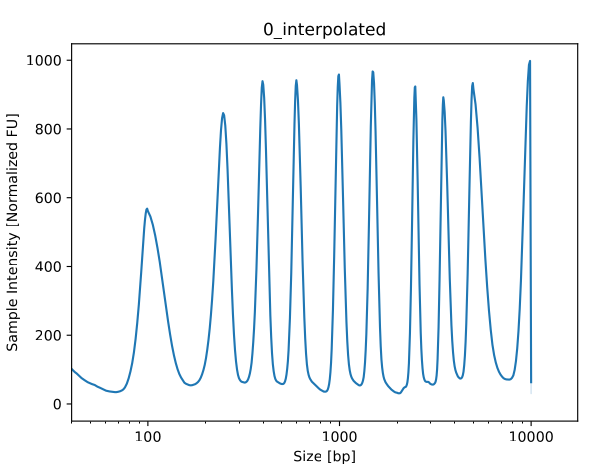
To manually adjust peak detection parameters, please refer to the Advanced Settings. Based on the annotation file, DNAvi will assign actual base pair positions to the data:
Handling of missing or extra ladder peaks
If DNAvi detects more or less peaks in your image/signal table than expected from the ladder annotation file, it will throw an error, and take a note in the log file.
This is how the error message looks like:
Inconsistent number of peaks between ladder file (10 bands) and the actual data in gel image/table ladder (11 bands).
Please check /.../qc/ to see what peaks are missing or whether your ladder is in the wrong position or if this is NOT a gel image.
Curvature correction
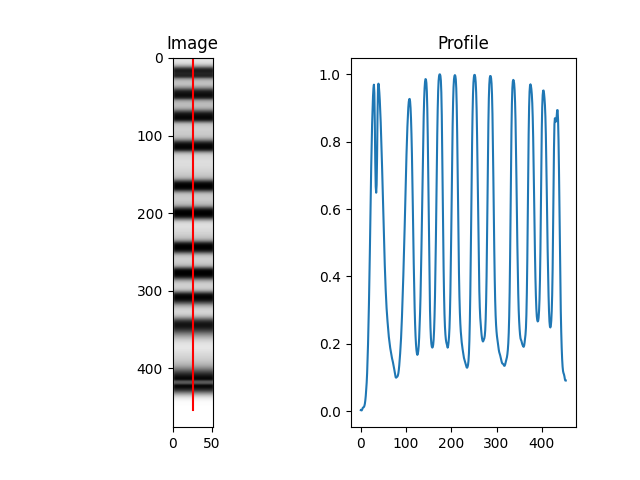
In gel images, DNAvi does not perform an extra curvature correction for the lanes. However, since only the center of the band is used to derive the marker profile, DNAvi’s marker detection is likely robust to slight angle deviations at the edge of the marker bands:
Handling marker bands
What is a marker band?
For many electrophoresis systems, the ladder DNA contains an upper and/or lower DNA marker band for calibration. However, the marker peak may not be of interest or even interfere with your analysis of cell-free DNA. Therefore, DNAvi offers the option to exclude marker bands from the analysis.
How to exclude marker peaks
To exclude markers, change the peak name in the ladder file to a string containing the word “marker”:
Peak |
Basepairs |
Name |
|---|---|---|
upper_marker |
10000 |
HSD5000 |
2 |
5000 |
HSD5000 |
… |
… |
… |
lower_marker |
15 |
HSD5000 |
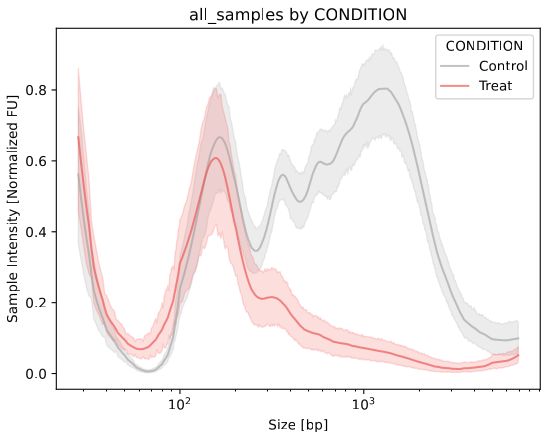
DNAvi will now exclude the peaks at 10,000 and 15 base pairs from its analysis with a certain safety-range that will be automatically determined based on the first sample:
How to exclude markers for each sample individually
Usually, it is sufficient to estimate the lower and upper marker cropping from the first sample. However, in some cases with very different DNA concentration (e.g., dilution series), it may be desired to determine the border for each sample individually. To do so, simply run DNAvi adding the - - correct parameter.
How to include marker peaks
You have two options. Either, you rename the markers so that the peak column does not contain the word marker anymore. Alternatively, keep the file unchanged and run DNAvi with the –include argument
dnavi -i tests/electropherogram.csv -l tests/ladder.csv -m tests/metadata.csv --include
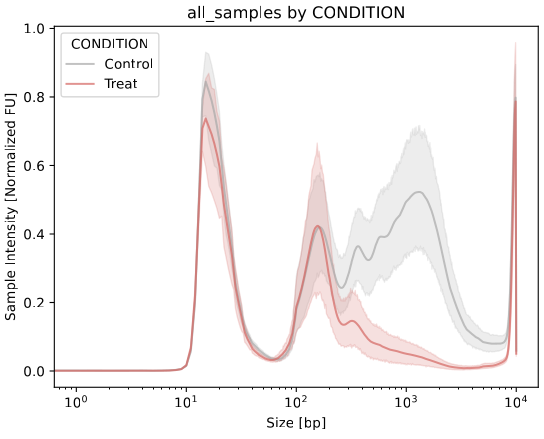
This will result in the markers being included, without the need to change the ladder file:
Handling multipe ladders (beta)
You may choose to combine electropherogram signal tables that were run with multiple (different) ladders. In this case, DNAvi offers an explorative feature to handle this:
Step 1: providing a multi-ladder ladder file.
Simply add the markers of the second ladder below the first ladder. Make sure the Name is changed accordingly. The order of the ladders in this file will dictate their translation in the input signal table.
Peak |
Basepairs |
Name |
|---|---|---|
Upper_marker |
10000 |
HSD5000 |
… |
… |
… |
Lower_marker |
15 |
HSD5000 |
1 |
48500 |
gDNA |
… |
… |
… |
Lower_marker |
100 |
gDNA |
Step 2: Combining input from electrophoresis with two different ladders
Next, you can create the input file by copy-pasting the second file (including the second ladder) to the first table, resulting in something like this:
Ladder |
Sample_1 |
… |
Ladder_2 |
Sample_7 |
Sample_8 |
|---|---|---|---|---|---|
2.56789 |
2.56789 |
… |
2.46789 |
2.56789 |
2.56789 |
2.56234 |
2.56234 |
… |
2.44234 |
2.56234 |
2.56234 |
1.83585 |
1.83585 |
… |
1.43585 |
1.83585 |
1.83585 |
… |
… |
… |
… |
… |
… |
3.45456 |
2.56789 |
… |
3.55456 |
2.56789 |
2.56789 |
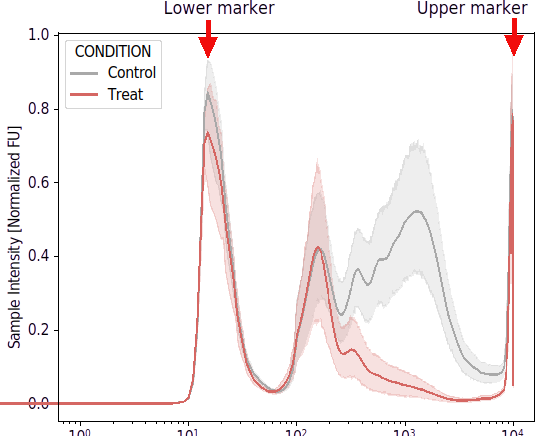
When we now run DNAvi, samples 1-6 will be size-annotated using the HSD5000 ladder, samples 7-8 however will be size-annotated with the gDNA ladder.
dnavi -i tests/electropherogram_multiladder.csv -l tests/ladder.csv -m tests/metadata.csv
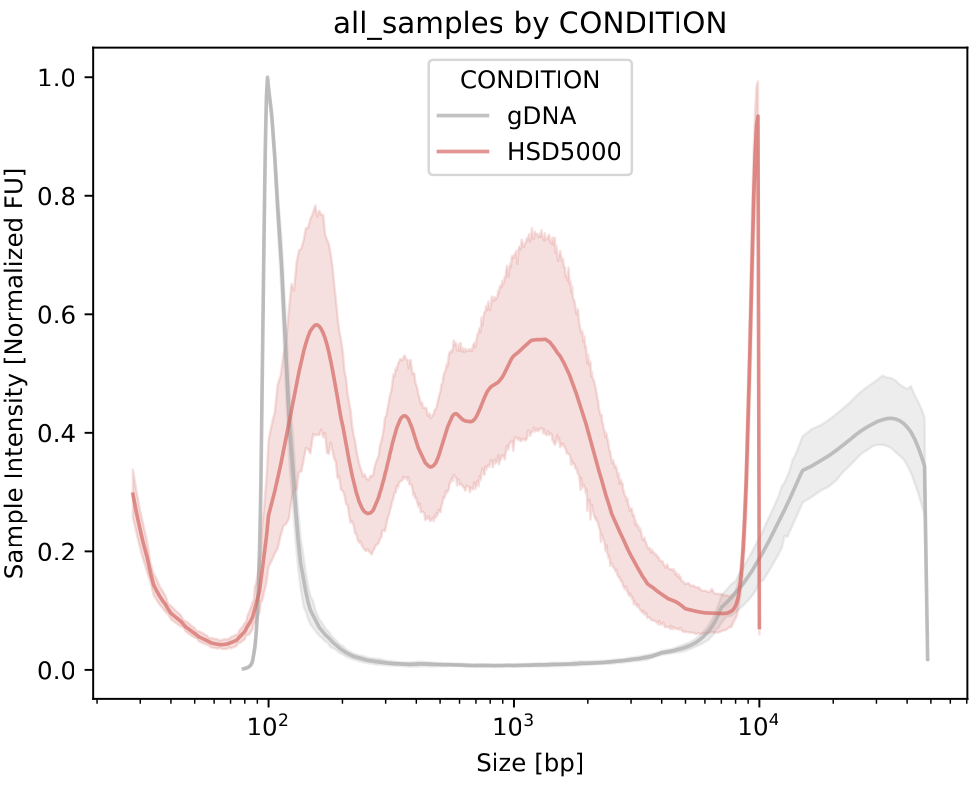
… As you can see, the control group is annotated with the HSD5000 marker, the treat group with the high molecular weight marker.