Statistics
This section describes DNAvi’s statistical analyses and outputs.
Basic statistics
This table is a broad description of your dataset, specifically all numerical data provided.
sample |
Skewness |
Entropy |
AUC |
|---|---|---|---|
Sample_1 |
-0.506815236748803 |
5.82798573207947 |
1887.20275909115 |
Sample_2 |
-0.397997767576633 |
5.78724522789374 |
1873.61515282988 |
Sample_3 |
0.0450158293194279 |
5.81663576539858 |
2153.11636771802 |
Sample_4 |
1.51560919314785 |
5.77731789999923 |
853.845586533094 |
- The following metrics are provided and exemplified based on the “bp_pos” column:
Skewness - skew of the size distribution, ~ 0 for normally distributed data
Entropy - Shannon entropy of the distribution
AUC - total area under the signal intensity curve
Peak statistics
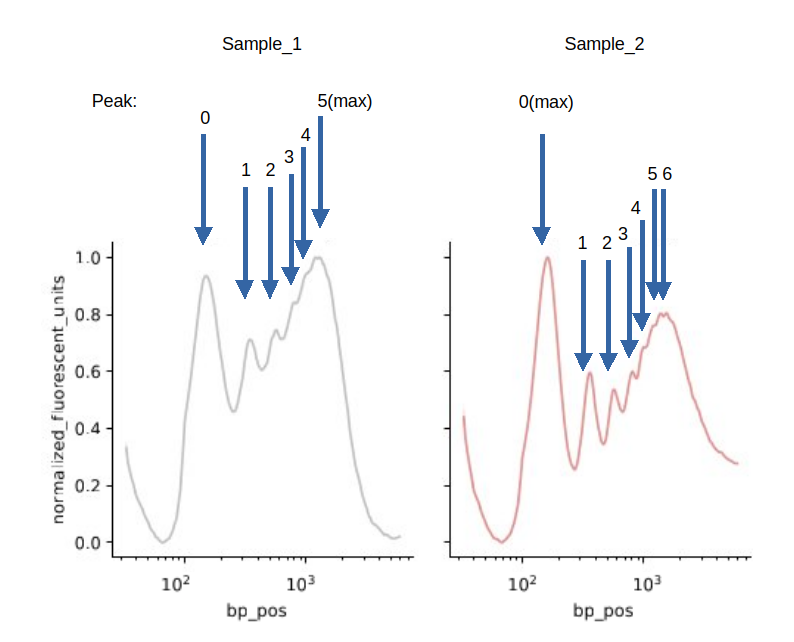
This table contains information on average sizes and individual peaks. Let’s have a look at the line plots for two samples to understand the corresponding statistics:
sample |
region_id |
From [bp] |
To [bp] |
AUC |
value |
unit |
CONDITION |
|---|---|---|---|---|---|---|---|
Sample_1 |
Mononucleosomal (100-200 bp) |
100 |
200 |
73.8961612203105 |
10.6 |
percent total DNA (%) |
Control |
Sample_1 |
Dinucleosomal (201-400 bp) |
201 |
400 |
115.647800412261 |
15 |
percent total DNA (%) |
Control |
Sample_1 |
modal_size |
1282.6 |
bp |
Control |
|||
Sample_1 |
median_size |
820.7 |
bp |
Control |
|||
Sample_1 |
average_size |
962.91 |
bp |
Control |
|||
Sample_1 |
likely gDNA (>3.5kB) |
3501 |
0 |
0 |
percent total DNA (%) |
Control |
|
… |
… |
… |
… |
… |
… |
… |
… |
Sample_2 |
Mononucleosomal (100-200 bp) |
100 |
200 |
72.414924632541 |
11.5 |
percent total DNA (%) |
Treat |
Rationale for adding peaks to the statistical evaluation (beyond nucleosomal fractions):
Our rationale is to catch the rare cases in which for example profiles are compared across species with larger nucleosomal differences,e.g. if the user defined the mononucleosomal interval from 100-200 bp but species A’s mononucleosomal peak is at 140 bp and species B’s mononucleosomal peak is at 210 bp. In this case, DNAvi reports there is a lower mononucleosomal fraction in B, which is technically true but biologically not correct. Since both peaks would be the first peaks in their respective sample (peak # 0) DNAvi would still compare them against each other.
List of metrics:
- For each sample, these metrics are provided:
average_size : the average fragment size in bp, estimated from the signal table (histogram)
median_size : the median in bp, estimated from the signal table (histogram)
mode : the mode value in bp, estimated from the signal table (histogram)
max_peak: the most intense peak (peak with highest fluorescent signal) of this sample
metadata: additional columns assigning categories if Metadata were provided
peak_id: the detected peaks (0-based) for each sample, numbered from low to high fragment size, and their metrics. In the example, 6 peaks are detected in Sample_1 while 7 peaks detected in Sample_2.
a variety of nucleosomal fractions : the percentage of cfDNA in specific size intervals. Customizable!
estimated genomic DNA content : the percentage of estimated gDNA (based on high molecular weight DNA thresholds). Customizable!
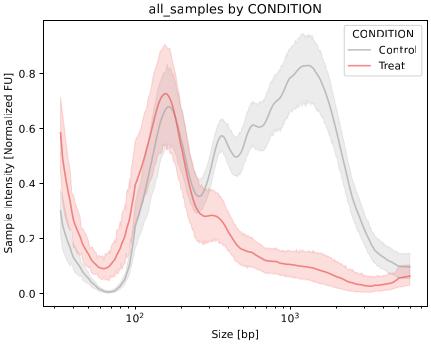
Group statistics
For each variable specified in the Metadata a table containing statistical testing results is provided. Let’s have a look at an example where cell-free DNA from two groups (Control vs. Treatment) were compared. The metadata-based evaluation allows to answer biological questions (see also next section).
Note: DNAvi will choose the statistical test based on your group data distribution, by doing different tests:
Shapiro-Wilk test (can the hypothesis of a normal distribution be rejected),
Levene test (can we assume all input samples are from populations with equal variances)
Group size determination (2 or more)
peak_name |
test_performed |
p_value |
p<0.05 |
posthoc_p_values |
unique_peak |
average |
modal |
median |
groups |
|---|---|---|---|---|---|---|---|---|---|
Entropy |
Mann Whitney U - test (independent) |
0.00426476491403054 |
True |
False |
{‘Control’: 5.865591799223451, ‘Treat’: 5.86151065750034} |
{‘Control’: 5.865591799223451, ‘Treat’: 5.86151065750034} |
{‘Control’: 5.87099615514526, ‘Treat’: 5.557442303844718} |
{‘Control’: [5.865591799223451, 5.987446600640773, 5.8670784396973925, 5.839555708376522, 5.969574526407146, 5.96134972606642, 5.874913870593128, 5.883527821378718, 5.883778304793762, 5.817900357834347, 5.865139545705292, 5.857118270596429], ‘Treat’: [5.86151065750034, 5.880446060580317, 6.016368189069645, 5.4153387381142695, 5.595997957362384, 5.455760308598386, 5.043437005348271, 4.8948447448447325, 5.012797646487333, 5.6236004755719025, 5.573743181915763, 5.541141425773674]} |
|
Skewness |
Mann Whitney U - test (independent) |
0.000155795893087883 |
True |
False |
{‘Control’: -0.34478990613058524, ‘Treat’: 1.4509361530668134} |
{‘Control’: -0.34478990613058524, ‘Treat’: 1.4509361530668134} |
{‘Control’: -0.0691211178053974, ‘Treat’: 1.572599772068185} |
{‘Control’: [-0.34478990613058524, -0.22967891006966357, 0.017633367378628025, -0.23330547043676542, -0.15587560298942282, 0.15549311955267353, -0.2144185871377651, 0.20025273895900966, 0.2494825439549606, -0.21159061388413317, 0.1401461999955842, 1.557492439982876], ‘Treat’: [1.4509361530668134, 1.2121412241636296, 0.5178865697186315, 1.4202875399156139, 1.214632959789608, 1.167055179393155, 2.8461464319879632, 2.8931051188421475, 2.996676248959314, 1.7175063605726535, 1.6942633910695566, 1.9061691013013036]} |
|
AUC (total) |
Mann Whitney U - test (independent) |
0.000308044705627747 |
True |
False |
{‘Control’: 1977.0039242211726, ‘Treat’: 1150.8732976155613} |
{‘Control’: 1977.0039242211726, ‘Treat’: 1150.8732976155613} |
{‘Control’: 2037.19994608536, ‘Treat’: 446.8295477358479} |
{‘Control’: [1977.0039242211726, 2488.317427756123, 1995.8340040624616, 1392.5936244420507, 2108.1807467814738, 1746.6977652366477, 2078.565888108258, 2185.576003863833, 2297.8221858652732, 1937.6167312010016, 2293.069739683835, 1058.6009747065525], ‘Treat’: [1150.8732976155613, 1050.9966217466347, 2148.5712962187454, 429.72898421706975, 593.2679571843505, 439.71657791710925, 175.26235323511924, 142.25950773242752, 162.63262352124667, 481.86142694920306, 453.9425175545865, 401.46239743060187]} |
|
Mononucleosomal (100-200 bp) |
Student’s t - test (independent) unequal variance) |
0.000262647051538621 |
True |
False |
{‘Control’: 10.5, ‘Treat’: 15.5} |
{‘Control’: 10.5, ‘Treat’: 15.5} |
{‘Control’: 8.75, ‘Treat’: 29.05} |
{‘Control’: [10.5, 10.9, 7.0, 13.8, 11.7, 13.3, 6.5, 5.0, 4.7, 5.3, 3.2, 14.9], ‘Treat’: [15.5, 20.1, 13.1, 31.7, 26.5, 27.8, 55.9, 58.4, 61.1, 29.3, 28.8, 32.4]} |
|
Dinucleosomal (201-400 bp) |
Student’s t - test (independent) assume equal variance) |
3.30136607702543e-07 |
True |
False |
{‘Control’: 15.0, ‘Treat’: 25.1} |
{‘Control’: 15.0, ‘Treat’: 25.1} |
{‘Control’: 13.1, ‘Treat’: 28.4} |
{‘Control’: [15.0, 11.6, 12.9, 17.7, 13.2, 13.0, 15.3, 10.3, 8.9, 16.5, 9.5, 23.7], ‘Treat’: [25.1, 25.6, 16.7, 28.2, 31.8, 30.7, 33.2, 19.8, 26.6, 28.6, 30.9, 30.3]} |
|
Trinucleosomal (401-600 bp) |
Mann Whitney U - test (independent) |
0.225043021591528 |
False |
False |
{‘Control’: 12.8, ‘Treat’: 11.0} |
{‘Control’: 12.8, ‘Treat’: 11.0} |
{‘Control’: 11.85, ‘Treat’: 11.0} |
{‘Control’: [12.8, 8.8, 12.6, 13.7, 9.6, 9.7, 14.8, 11.1, 10.0, 15.2, 10.8, 15.5], ‘Treat’: [11.0, 11.0, 8.5, 8.8, 12.0, 11.5, 1.6, 0.0, 0.0, 14.1, 15.1, 14.3]} |
|
Tetranucleosomal (601-800 bp) |
Mann Whitney U - test (independent) |
0.000171495125256007 |
True |
False |
{‘Control’: 9.4, ‘Treat’: 0.0} |
{‘Control’: 9.4, ‘Treat’: 0.0} |
{‘Control’: 9.100000000000001, ‘Treat’: 5.2} |
{‘Control’: [9.4, 6.6, 10.1, 9.6, 7.0, 7.1, 10.8, 9.3, 8.8, 11.1, 8.9, 7.6], ‘Treat’: [5.2, 5.6, 5.2, 3.7, 5.3, 5.0, 0.0, 0.0, 0.0, 7.1, 7.4, 6.9]} |
|
Pentanucleosomal (801-1000 bp) |
Mann Whitney U - test (independent) |
3.587626116728915e-05 |
True |
False |
{‘Control’: 10.8, ‘Treat’: 0.0} |
{‘Control’: 10.8, ‘Treat’: 0.0} |
{‘Control’: 10.75, ‘Treat’: 4.800000000000001} |
{‘Control’: [10.8, 8.0, 12.0, 10.6, 8.1, 8.5, 11.9, 11.5, 11.0, 12.1, 10.7, 6.7], ‘Treat’: [5.4, 5.8, 6.2, 0.6, 4.2, 3.6, 0.0, 0.0, 0.0, 6.2, 6.3, 5.7]} |
|
Hexanucleosomal (1001-1200 bp) |
Mann Whitney U - test (independent) |
5.096629552848998e-05 |
True |
False |
{‘Control’: 7.4, ‘Treat’: 0.0} |
{‘Control’: 7.4, ‘Treat’: 0.0} |
{‘Control’: 7.45, ‘Treat’: 2.6} |
{‘Control’: [7.4, 5.8, 8.2, 6.8, 5.7, 6.0, 7.5, 8.1, 7.9, 7.8, 7.6, 3.9], ‘Treat’: [3.8, 3.9, 4.5, 0.0, 2.1, 1.2, 0.0, 0.0, 0.0, 3.4, 3.3, 3.1]} |
|
Heptanucleosomal (1201-1400 bp) |
Mann Whitney U - test (independent) |
7.07050733128538e-05 |
True |
False |
{‘Control’: 6.3, ‘Treat’: 0.0} |
{‘Control’: 6.3, ‘Treat’: 0.0} |
{‘Control’: 7.35, ‘Treat’: 2.1500000000000004} |
{‘Control’: [7.5, 6.3, 8.2, 6.6, 6.1, 6.3, 7.2, 8.3, 8.4, 7.7, 8.2, 3.7], ‘Treat’: [4.4, 4.1, 5.0, 0.0, 1.6, 0.0, 0.0, 0.0, 0.0, 3.1, 2.9, 2.7]} |
|
Octanucleosomal (1401-1600 bp) |
Mann Whitney U - test (independent) |
6.714883891516948e-05 |
True |
False |
{‘Control’: 6.1, ‘Treat’: 0.0} |
{‘Control’: 6.1, ‘Treat’: 0.0} |
{‘Control’: 6.4, ‘Treat’: 0.25} |
{‘Control’: [6.7, 6.1, 7.3, 5.7, 5.9, 6.0, 6.1, 7.4, 7.7, 6.8, 7.9, 3.4], ‘Treat’: [4.3, 3.9, 5.0, 0.0, 0.0, 0.0, 0.0, 0.0, 0.0, 2.5, 2.1, 0.5]} |
|
Nonanucleosomal (1601-1800 bp) |
Mann Whitney U - test (independent) |
7.07118682460294e-05 |
True |
False |
{‘Control’: 4.8, ‘Treat’: 0.0} |
{‘Control’: 4.8, ‘Treat’: 0.0} |
{‘Control’: 4.8, ‘Treat’: 0.0} |
{‘Control’: [4.8, 4.8, 5.2, 3.9, 4.7, 4.6, 4.4, 5.5, 5.9, 4.8, 6.3, 2.6], ‘Treat’: [3.5, 3.0, 4.1, 0.0, 0.0, 0.0, 0.0, 0.0, 0.0, 1.2, 0.0, 0.0]} |
|
Decanucleosomal (1801-2000 bp) |
Mann Whitney U - test (independent) |
7.995343962722956e-05 |
True |
False |
{‘Control’: 4.4, ‘Treat’: 0.0} |
{‘Control’: 4.4, ‘Treat’: 0.0} |
{‘Control’: 4.300000000000001, ‘Treat’: 0.0} |
{‘Control’: [4.0, 4.5, 4.4, 3.2, 4.4, 4.2, 3.7, 4.8, 5.3, 3.9, 5.7, 2.4], ‘Treat’: [2.9, 2.7, 3.8, 0.0, 0.0, 0.0, 0.0, 0.0, 0.0, 0.0, 0.0, 0.0]} |
|
Polynucleosomal (2001-7000 bp) |
Mann Whitney U - test (independent) |
0.00166787381374531 |
True |
False |
{‘Control’: 9.5, ‘Treat’: 0.0} |
{‘Control’: 9.5, ‘Treat’: 0.0} |
{‘Control’: 16.95, ‘Treat’: 0.0} |
{‘Control’: [9.5, 25.6, 11.4, 6.5, 22.7, 18.6, 11.2, 18.2, 21.3, 8.5, 21.1, 15.7], ‘Treat’: [18.0, 8.5, 25.5, 0.0, 0.0, 0.0, 0.0, 0.0, 0.0, 0.0, 0.0, 0.0]} |
|
Non-mono (> 250 bp) |
Student’s t - test (independent) unequal variance) |
5.565065976155082e-05 |
True |
False |
{‘Control’: 84.1, ‘Treat’: 57.1} |
{‘Control’: 84.1, ‘Treat’: 57.1} |
{‘Control’: 87.05000000000001, ‘Treat’: 49.2} |
{‘Control’: [84.1, 84.9, 89.3, 79.3, 83.7, 81.4, 89.2, 92.8, 93.5, 89.9, 94.4, 75.3], ‘Treat’: [74.7, 65.8, 79.2, 28.8, 44.5, 39.9, 19.7, 11.3, 15.1, 57.1, 57.1, 53.9]} |
|
Oligo (> 1250 bp) |
Mann Whitney U - test (independent) |
0.000558462027759282 |
True |
False |
{‘Control’: 30.9, ‘Treat’: 0.0} |
{‘Control’: 30.9, ‘Treat’: 0.0} |
{‘Control’: 36.5, ‘Treat’: 1.85} |
{‘Control’: [30.9, 45.9, 34.7, 24.4, 42.6, 38.3, 30.9, 42.4, 46.7, 30.0, 47.4, 26.9], ‘Treat’: [32.2, 21.3, 42.3, 0.0, 1.1, 0.0, 0.0, 0.0, 0.0, 6.0, 4.3, 2.6]} |
|
Mitochondrial/TF |
Mann Whitney U - test (independent) |
0.000122092699974362 |
True |
False |
{‘Control’: 0.5, ‘Treat’: 0.8} |
{‘Control’: 0.5, ‘Treat’: 0.8} |
{‘Control’: 0.5, ‘Treat’: 7.1} |
{‘Control’: [1.4, 0.9, 0.5, 1.8, 0.6, 2.4, 0.5, 0.3, 0.2, 0.2, 0.0, 0.0], ‘Treat’: [0.8, 5.5, 2.2, 26.1, 15.8, 19.4, 8.7, 20.5, 11.4, 4.0, 2.8, 3.7]} |
|
Short (100-400 bp) |
Student’s t - test (independent) assume equal variance) |
7.434964670831664e-07 |
True |
False |
{‘Control’: 25.5, ‘Treat’: 40.5} |
{‘Control’: 25.5, ‘Treat’: 40.5} |
{‘Control’: 22.15, ‘Treat’: 59.15} |
{‘Control’: [25.5, 22.5, 19.9, 31.5, 24.8, 26.3, 21.8, 15.3, 13.5, 21.7, 12.7, 38.5], ‘Treat’: [40.5, 45.6, 29.8, 59.9, 58.3, 58.5, 89.1, 78.2, 87.7, 57.9, 59.8, 62.7]} |
|
Long (> 401 bp) |
Student’s t - test (independent) unequal variance) |
8.979074392573866e-06 |
True |
False |
{‘Control’: 73.0, ‘Treat’: 0.0} |
{‘Control’: 73.0, ‘Treat’: 0.0} |
{‘Control’: 77.0, ‘Treat’: 29.200000000000003} |
{‘Control’: [73.0, 76.4, 79.5, 66.6, 74.4, 71.0, 77.6, 84.3, 86.2, 78.0, 87.3, 61.5], ‘Treat’: [58.5, 48.5, 67.7, 13.0, 25.2, 21.3, 1.6, 0.0, 0.0, 37.6, 37.0, 33.2]} |
|
Short (50-700 bp) |
Student’s t - test (independent) assume equal variance) |
4.3518925147105816e-07 |
True |
False |
{‘Control’: 44.2, ‘Treat’: 100.0} |
{‘Control’: 44.2, ‘Treat’: 100.0} |
{‘Control’: 40.2, ‘Treat’: 87.05} |
{‘Control’: [44.2, 35.3, 37.8, 51.7, 38.6, 41.8, 42.3, 30.9, 27.6, 42.5, 27.7, 58.0], ‘Treat’: [55.2, 65.3, 43.2, 97.6, 89.5, 92.8, 100.0, 100.0, 100.0, 80.1, 81.8, 84.6]} |
|
potential gDNA (1-5kB) |
Mann Whitney U - test (independent) |
0.000298833297689841 |
True |
False |
{‘Control’: 39.9, ‘Treat’: 0.0} |
{‘Control’: 39.9, ‘Treat’: 0.0} |
{‘Control’: 45.2, ‘Treat’: 5.0} |
{‘Control’: [39.9, 52.9, 44.7, 32.7, 49.6, 45.7, 40.0, 52.3, 56.4, 39.6, 56.8, 31.5], ‘Treat’: [35.9, 25.9, 47.7, 0.0, 3.7, 1.2, 0.0, 0.0, 0.0, 10.2, 8.3, 6.3]} |
|
likely gDNA (>3.5kB) |
Mann Whitney U - test (independent) |
0.123131990699528 |
False |
False |
{‘Control’: 0.0, ‘Treat’: 0.0} |
{‘Control’: 0.0, ‘Treat’: 0.0} |
{‘Control’: 2.1, ‘Treat’: 0.0} |
{‘Control’: [0.0, 5.8, 0.0, 0.0, 4.4, 2.8, 0.2, 2.6, 3.1, 0.0, 1.6, 5.0], ‘Treat’: [10.0, 0.3, 7.1, 0.0, 0.0, 0.0, 0.0, 0.0, 0.0, 0.0, 0.0, 0.0]} |
|
very likely gDNA (>5kB) |
Mann Whitney U - test (independent) |
0.65122130965684 |
False |
False |
{‘Control’: 0.0, ‘Treat’: 0.0} |
{‘Control’: 0.0, ‘Treat’: 0.0} |
{‘Control’: 0.0, ‘Treat’: 0.0} |
{‘Control’: [0.0, 0.1, 0.0, 0.0, 0.1, 0.0, 0.0, 0.1, 0.1, 0.0, 0.0, 0.1], ‘Treat’: [1.0, 0.1, 0.2, 0.0, 0.0, 0.0, 0.0, 0.0, 0.0, 0.0, 0.0, 0.0]} |
|
very very likely gDNA (>8kB) |
Student’s t - test (independent) assume equal variance) |
False |
False |
{‘Control’: 0.0, ‘Treat’: 0.0} |
{‘Control’: 0.0, ‘Treat’: 0.0} |
{‘Control’: 0.0, ‘Treat’: 0.0} |
{‘Control’: [0.0, 0.0, 0.0, 0.0, 0.0, 0.0, 0.0, 0.0, 0.0, 0.0, 0.0, 0.0], ‘Treat’: [0.0, 0.0, 0.0, 0.0, 0.0, 0.0, 0.0, 0.0, 0.0, 0.0, 0.0, 0.0]} |
||
short-to-long fragment ratio |
Student’s t - test (independent) assume equal variance) |
False |
False |
{‘Control’: 0.3493150684931507, ‘Treat’: inf} |
{‘Control’: 0.3493150684931507, ‘Treat’: inf} |
{‘Control’: 0.28771522642629677, ‘Treat’: 2.1010231401797665} |
{‘Control’: [0.3493150684931507, 0.2945026178010471, 0.25031446540880503, 0.472972972972973, 0.3333333333333333, 0.3704225352112676, 0.28092783505154645, 0.1814946619217082, 0.15661252900232017, 0.2782051282051282, 0.14547537227949597, 0.6260162601626016], ‘Treat’: [0.6923076923076923, 0.9402061855670103, 0.4401772525849335, 4.607692307692307, 2.3134920634920633, 2.7464788732394365, 55.68749999999999, inf, inf, 1.5398936170212765, 1.6162162162162161, 1.8885542168674698]} |
||
average_size |
Mann Whitney U - test (independent) |
0.00135394144309263 |
True |
False |
{‘Control’: 987.52, ‘Treat’: 1235.64} |
{‘Control’: 987.52, ‘Treat’: 1235.64} |
{‘Control’: 1131.74, ‘Treat’: 478.64} |
{‘Control’: [987.52, 1382.23, 1102.22, 859.48, 1282.85, 1161.26, 1041.21, 1261.99, 1349.29, 999.0, 1342.87, 1008.7], ‘Treat’: [1235.64, 827.85, 1326.54, 378.28, 479.73, 347.68, 281.56, 224.09, 274.1, 530.14, 501.03, 477.55]} |
|
modal_size |
Mann Whitney U - test (independent) |
0.0177025754599682 |
True |
False |
{‘Control’: 161.2, ‘Treat’: 155.1} |
{‘Control’: 161.2, ‘Treat’: 155.1} |
{‘Control’: 1063.75, ‘Treat’: 156.64999999999998} |
{‘Control’: [1282.6, 161.2, 1163.0, 161.2, 167.3, 136.7, 986.2, 1184.8, 1380.4, 1141.3, 1434.8, 188.8], ‘Treat’: [5128.2, 158.2, 161.2, 133.7, 176.5, 149.0, 167.3, 142.9, 155.1, 155.1, 164.3, 155.1]} |
|
median_size |
Mann Whitney U - test (independent) |
0.000243913267588222 |
True |
False |
{‘Control’: 841.4, ‘Treat’: 182.7} |
{‘Control’: 841.4, ‘Treat’: 182.7} |
{‘Control’: 917.2, ‘Treat’: 264.85} |
{‘Control’: [827.6, 1108.7, 931.0, 669.0, 993.1, 903.4, 841.4, 1065.2, 1163.0, 841.4, 1184.8, 533.3], ‘Treat’: [568.9, 396.5, 937.9, 182.7, 237.8, 213.3, 182.7, 149.0, 167.3, 316.3, 316.3, 291.9]} |
|
peak_0 |
Mann Whitney U - test (independent) |
0.124620803996843 |
False |
False |
{‘Control’: 161.22, ‘Treat’: 155.1} |
{‘Control’: 161.22, ‘Treat’: 155.1} |
{‘Control’: 162.755, ‘Treat’: 156.63} |
{‘Control’: [152.04, 161.22, 164.29, 161.22, 167.35, 136.73, 986.21, 161.22, 158.16, 1141.3, 1434.78, 188.78], ‘Treat’: [185.71, 158.16, 161.22, 133.67, 176.53, 148.98, 167.35, 142.86, 155.1, 155.1, 164.29, 155.1]} |
|
peak_1 |
Mann Whitney U - test (independent) |
0.2 |
False |
False |
{‘Control’: 1282.61, ‘Treat’: 1542.25} |
{‘Control’: 1282.61, ‘Treat’: 1542.25} |
{‘Control’: 1086.96, ‘Treat’: 1542.25} |
{‘Control’: [1282.61, 361.63, 1163.04, 1086.96, 375.58, 330.23, 1184.78, 1380.43, 400.0], ‘Treat’: [1542.25]} |
|
max_peak |
Mann Whitney U - test (independent) |
0.00458877414557382 |
True |
False |
{‘Control’: 161.22, ‘Treat’: 155.1} |
{‘Control’: 161.22, ‘Treat’: 155.1} |
{‘Control’: 1063.755, ‘Treat’: 156.63} |
{‘Control’: [1282.61, 161.22, 1163.04, 161.22, 167.35, 136.73, 986.21, 1184.78, 1380.43, 1141.3, 1434.78, 188.78], ‘Treat’: [185.71, 158.16, 161.22, 133.67, 176.53, 148.98, 167.35, 142.86, 155.1, 155.1, 164.29, 155.1]} |
|
peak_2 |
None (peak unique to group) |
1 |
True |
{‘Control’: 1542.25} |
{‘Control’: 1542.25} |
{‘Control’: 1456.52} |
{‘Control’: [1542.25, 1456.52, 1369.57]} |
Result: In this example, the average_size, max_peak, and also the first peak size do show a statistical difference between the two groups, as the Kruskal Wallis test computed a p value < 0.05. Unique peaks refer to peaks that only occur in one group, but not in the other. Because they are unique to a group, no statistical comparison is performed for those peaks.
Paired analyses
In case your samples are related (e.g. different time points of the same individual are to be compared), you will need to tell DNAvi to run the appropriate statistical test by adding the command line option - - paired.
DNAvi will then either perform a - Student’s t - test (paired) - if normal distribution is assumed - Wilcoxon signed-rank test (paired) - if the hypothesis of a normal distribution is rejected