Quickstart
Check results
Lets make sure outputs are created, we will look for the folder:
cd tests
ls
>> electropherogram  ...
We can see the new folder electropherogram was created …
cd electropherogram
ls
plots  qc  stats
tree
>> ├── plots
>> │   ├── all_samples.pdf
>> │   ├── all_samples_by_CONDITION.pdf
>> │   ├── all_samples_summary.pdf
>> │   ├── cluster_by_CONDITION.pdf
>> │   └── sourcedata.csv
>> ├── qc
>> │   ├── 0_interpolated.pdf
>> │   ├── bp_translation.csv
>> │   ├── info.csv
>> │   ├── interpolated.csv
>> │   ├── peaks_0_0.pdf
>> │   └── peaks_all_interpolated.pdf
>> └── stats
>>     ├── basic_statistics.csv
>>     ├── group_statistics_by_CONDITION.csv
>>     ├── peak_statistics.csv
>>     ├── peak_statistics_CONDITION.pdf
>>     └── peak_statistics_sample.pdf
… and contains the 3 result directories. You can explore them by yourself or consult Outputs for more details.
Command line help
To see all DNAvi commands run:
dnavi --help
This will result in a display of command line arguments with additional explanations:
Welcome to
  ____  _   _    _        _
 |  _ |  \ | |  / \__   _(_)
 | | | |  \| | / _ \ \ / / |
 | |_| | |\  |/ ___ \ V /| |
 |____/|_| \_/_/   \_\_/ |_|

usage: dnavi [-h] [-i [<input-file-or-folder>]] -l [<ladder-file>] [-m [<metadata-file>]] [-n [<run-name>]] [-incl] [-un] [-nt [<sample_name>]]
                [-ml <int>] [-c [<config-file>]] [-iv [<(start,step)>]] [-p] [-cor] [--verbose] [-v]

Analyse Electropherogram data e.g. for cell-free DNA from liquid biopsies

options:
  -h, --help            show this help message and exit
  -i [<input-file-or-folder>], --input [<input-file-or-folder>]
                        Path to electropherogram table file or image file OR directory containing those files. Accepted formats: .csv/.png/.jpeg/.jpg or
                        directory containing those.
  -l [<ladder-file>], --ladder [<ladder-file>]
                        Path to ladder table file. Accepted format: .csv
  -m [<metadata-file>], --meta [<metadata-file>]
                        Path to metadata table file containing grouping information for input file (e.g. age, sex, disease). Accepted format: .csv
  -n [<run-name>], --name [<run-name>]
                        Name of your run/experiment. Will define output folder name
  -c [<config-file>], --config [<config-file>]
                        Define nucleosomal fractions with this path to a configuration file containing custom (nucleosome) intervals for statistics.
                        Accepted format: tab-separated text files (.txt)
  -iv [<(start,step)>], --interval [<(start,step)>]
                        Auto-generate nucleosomal size intervals by providing (start,step), e.g. start at 100 and increase by 200 bp
  -p, --paired          Perform paired statistical testing
  -un, --unnormalized   Do not perform min/max normalization. ATTENTION: will be DNA-concentration sensitive.
  -nt [<sample_name>], --normalize_to [<sample_name>]
                        Name of the sample to normalize all values to. ATTENTION: will be DNA-concentration sensitive.
  -ml <int>, --marker_lane <int>
                        Change the lane selected as the DNA marker/ladder, default is first lane (1). Using this will force to use the specified column
                        even if other columns are called Ladder already.
  -incl, --include      Include marker bands into analysis and plotting.
  -cor, --correct       Perform advanced automatic marker lane detection in samples with highly variant concentrations (e.g., dilution series), so that
                        the marker borders will be determined for each sample individually
  --verbose             increase output verbosity
  -v, --version         show program's version number and exit

Version: 0.2, created by Anja Hess <github.com/anjahess>.
Use a gel image as input
You can start the analysis from a gel image as well. We provide an example in the tests/ directory that comes with downloading DNAvi. Simply type:
dnavi -i tests/gel.png -l tests/ladder.csv -m tests/metadata_gel.csv
Watch DNAvi work:
Welcome to
____ _ _ _ _
| _ | \ | | / \__ _(_)
| | | | \| | / _ \ \ / / |
| |_| | |\ |/ ___ \ V /| |
|____/|_| \_/_/ \_\_/ |_|
--- Performing ladder check
--- Performing metadata check
------------------------------------------------------------
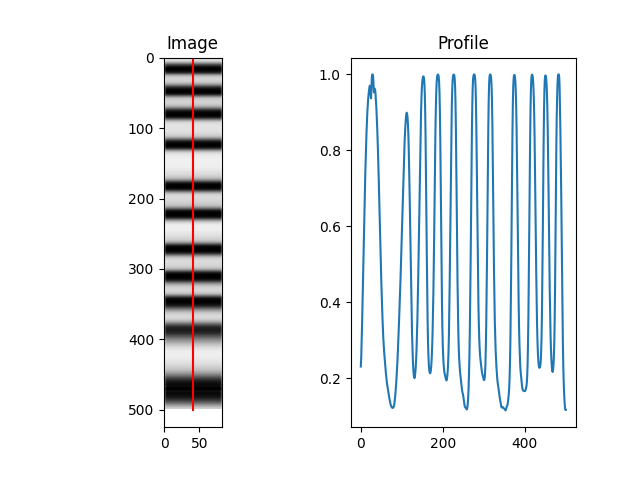
Loading image for signal table generation
------------------------------------------------------------
------------------------------------------------------------
DNA FRAGMENT SIZE ANALYSIS
------------------------------------------------------------
Image input: True
DNA file: tests/gel/signal_table.csv
Ladder file: tests/ladder.csv
Meta file: tests/metadata_gel.csv
Include marker: False
run_id: signal_table
results to: /.../DNAvi/tests/gel/
------------------------------------------------------------
Loading signal table
------------------------------------------------------------
--- Performing input check
Ladder 1 2 3 4
0 0.231248 0.077621 0.054479 0.066294 0.066193
1 0.252772 0.089723 0.063269 0.075393 0.074656
2 0.289584 0.110746 0.079725 0.092882 0.089840
------------------------------------------------------------
Calculating basepair positions based on ladder
------------------------------------------------------------
--- Ladder columns in data: 1 ---
--- Ladder translations found: 1 : ['HSD5000'] ---
--- Ladder #0: 11 peaks detected.
... Selecting HSD5000
--- Checking for marker bands
--- Found markers: [10000, 15]
------------------------------------------------------------
Height-normalizing data: True
Keeping markers: False
------------------------------------------------------------
--- Auto-detected marker cropping borders: 16.02409638554217 and 4531.25
------------------------------------------------------------
Parsing metadata
------------------------------------------------------------
--- WARNING: Image - ONLY first 4 entries used (out of 4)
--- Adding metatadata for CONDITION
{'1': 'Group A', '2': 'Group B', '3': 'Group A', '4': 'Group B'}
------------------------------------------------------------
Performing statistical analysis
------------------------------------------------------------
--- Nucleosomal fractions & peak analysis
--- Stats by CONDITION
--- Mononucleosomal (100-200 bp) - Student's t - test (independent) unequal variance): p = 0.03, (SIGNIFICANT)
--- Dinucleosomal (201-400 bp) - Student's t - test (independent) assume equal variance): p = 0.02, (SIGNIFICANT)
--- Heptanucleosomal (1201-1400 bp) - Student's t - test (independent) assume equal variance): p = 0.01, (SIGNIFICANT)
--- Octanucleosomal (1401-1600 bp) - Student's t - test (independent) unequal variance): p = 0.02, (SIGNIFICANT)
--- Decanucleosomal (1801-2000 bp) - Student's t - test (independent) unequal variance): p = 0.03, (SIGNIFICANT)
--- Oligo (> 1250 bp) - Student's t - test (independent) unequal variance): p = 0.04, (SIGNIFICANT)
--- Long (> 401 bp) - Student's t - test (independent) unequal variance): p = 0.03, (SIGNIFICANT)
--- Tape %cfDNA (50-700 bp) - Student's t - test (independent) unequal variance): p = 0.04, (SIGNIFICANT)
--- potential gDNA (1-5kB) - Student's t - test (independent) unequal variance): p = 0.03, (SIGNIFICANT)
--- short-to-long fragment ratio - Student's t - test (independent) unequal variance): p = 0.03, (SIGNIFICANT)
--- average_size - Student's t - test (independent) unequal variance): p = 0.03, (SIGNIFICANT)
--- median_size - Student's t - test (independent) unequal variance): p = 0.02, (SIGNIFICANT)
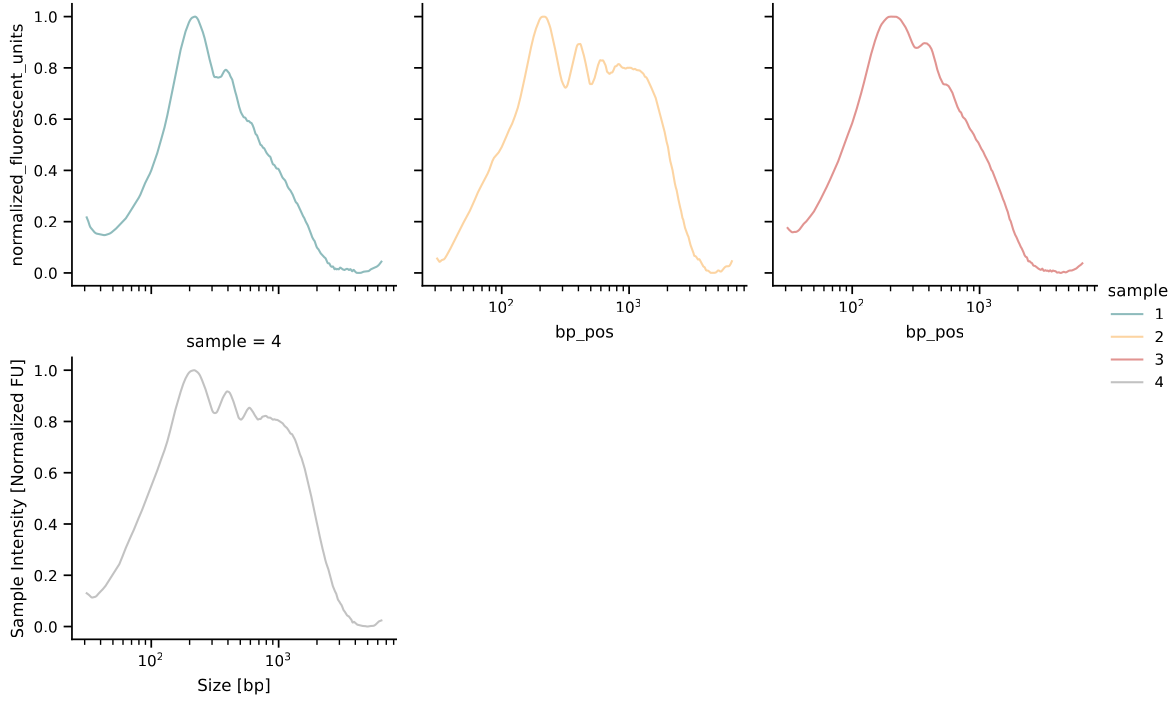
--- Plotting by sample
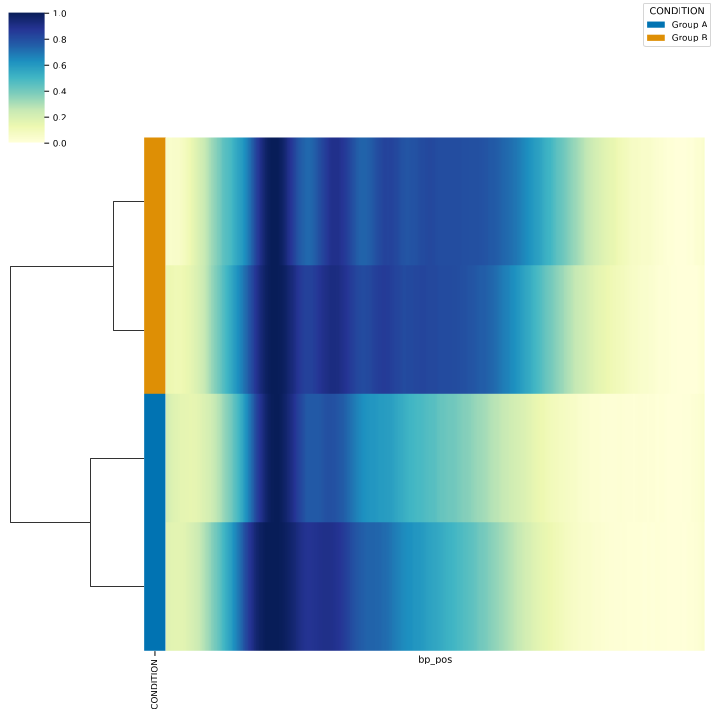
--- Plotting by CONDITION
------------------------------------------------------------
Finished basic analysis and statistics in 21.949937105178833
------------------------------------------------------------
------------------------------------------------------------
Plotting results
------------------------------------------------------------
--- Plotting by sample
--- Plotting by CONDITION
--- Sample grid plot
------------------------------------------------------------
Finished plotting in 26.767568111419678
------------------------------------------------------------
--- DONE. Results in same folder as input file.
And check the results (here are a few examples of the output):
Use a directory with multiple files as input
Sometimes you may wish to run DNAvi on multiple images / signal tables without restarting the analysis every single time. You do so by pointing DNAvi to the folder where your files are. We provide an example, you can simply type:
dnavi -i tests/multifolder -l tests/ladder.csv -m tests/metadata_multi.csv
Note: If processing multiple files, your metadata file needs to specify the file name in a separate column.
SAMPLE |
CONDITION |
FILE |
|---|---|---|
Sample_1 |
Group A |
gel1.png |
Sample_2 |
Group B |
gel1.png |
Sample_3 |
Group A |
gel1.png |
… |
… |
… |
Sample_6 |
Group A |
gel2.png |
… |
… |
… |
Sample_9 |
Group A |
gel3.png |
… |
… |
… |
Note: To enjoy a smooth analysis, only put signal tables or images into the multi-input folder.
DNAvi will then go through your files and create the usual outputs for each file inside the multi-input folder. On top of the interface there will be a short short message, indicating that your metafiles are parsed:
Welcome to
  ____  _   _    _        _
 |  _ |  \ | |  / \__   _(_)
 | | | |  \| | / _ \ \ / / |
 | |_| | |\  |/ ___ \ V /| |
 |____/|_| \_/_/   \_\_/ |_|

--- Performing ladder check
--- Performing metadata check
--- Checking folder tests/multifolder/
--- Getting metadata for gel3.jpg ---
--- Getting metadata for gel1.png ---
--- Getting metadata for gel2.png ---